Improvements to the Github Project visualiser - Estimations
Since my last post on the visualiser, I’ve been working half days - to spend more time at home & with my family. What this has meant is that sometimes, when I’m asked for estimates & dates, I am not up-to-date with the latest numbers. So in the last few weeks, I added estimation & project management capabilities to the repo.
Estimates & Scheduling
The last update added rxdb for better client side management of the retrieved data. And the ability to query based on the user’s criteria.
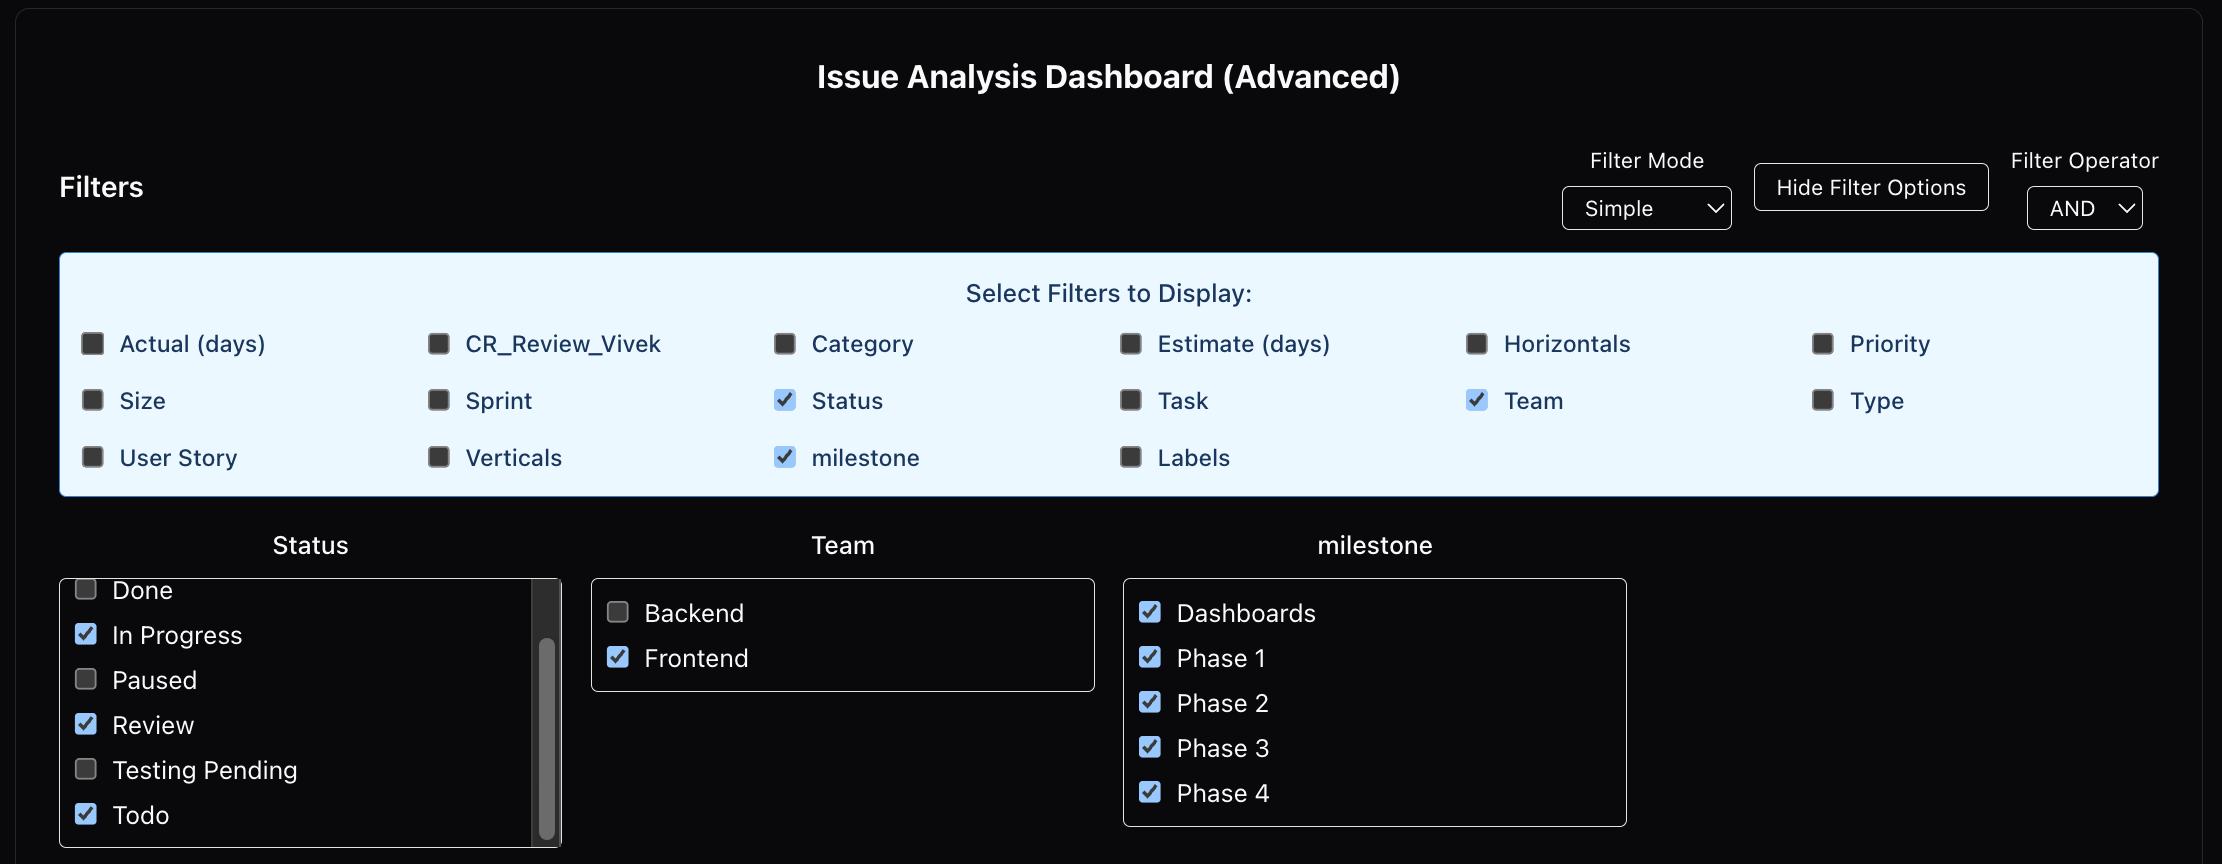
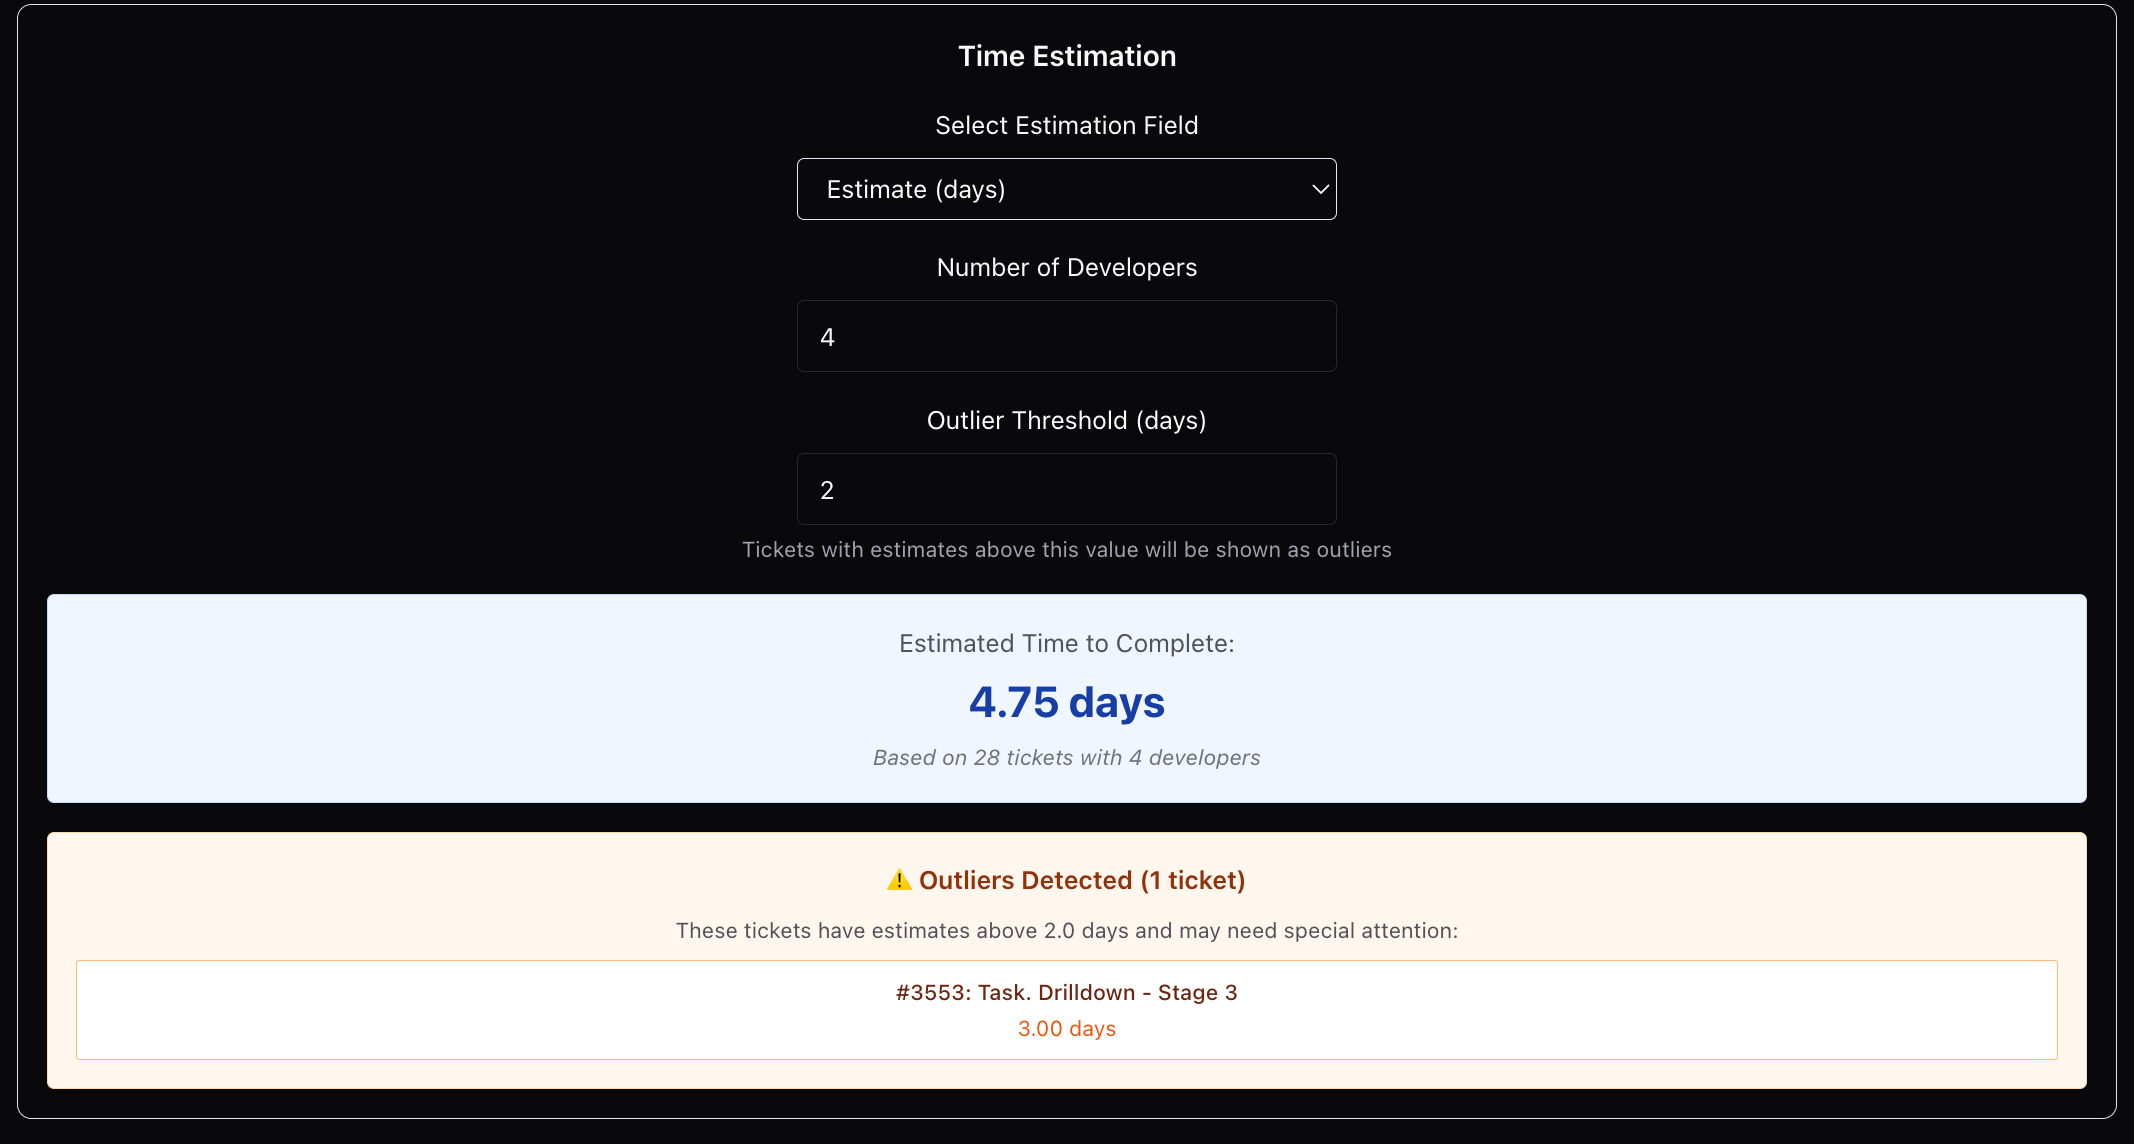
This criteria will then be applied to give you an overall estimation of how many days of effort are necessary
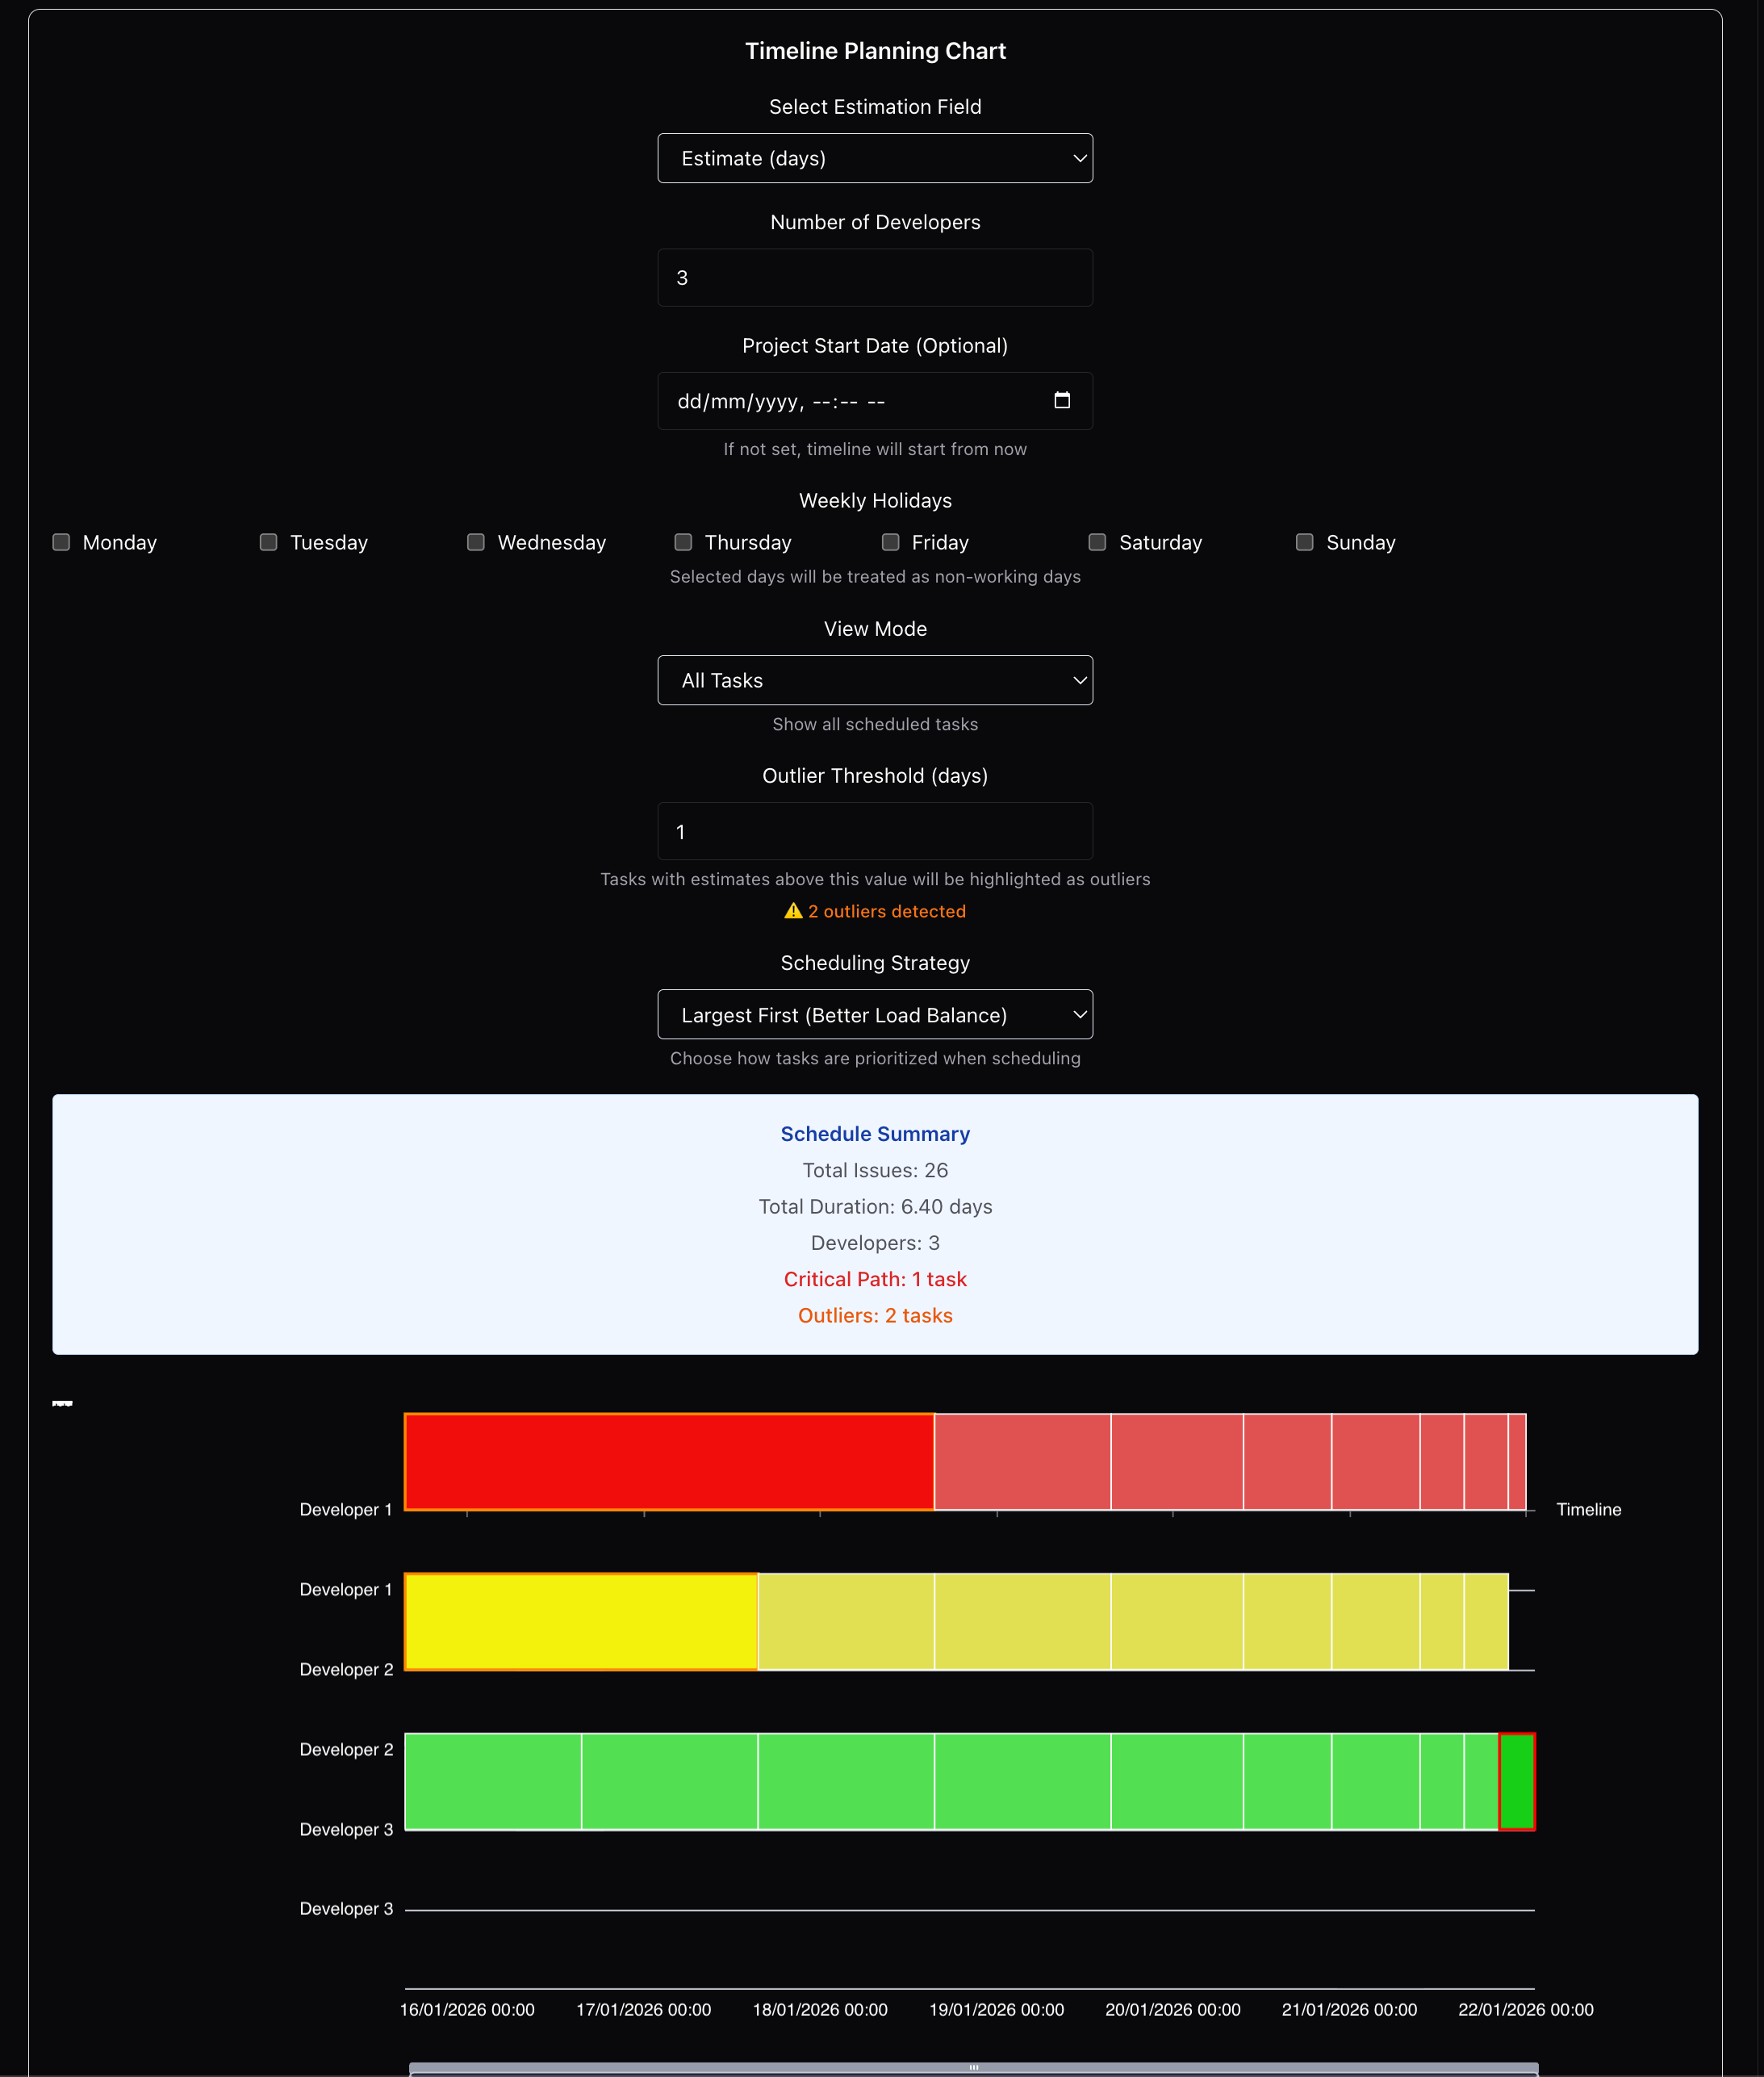
You can also provide details such as the number of developers in the project & it’ll provide you a gantt chart with a recommendation on how to prioritise & schedule the tickets
Next steps: While the visualiser is now quite powerful, it has become clunky. It may also be time to revisit the UX & make it more intuitive. Will work on making it more generic so users can use it on ANY github project without too much effort.
References